Tools of the (Data) Trade
Every professional out there requires well-designed and highest quality tools to do their job most efficiently – from cooking, sculpture or writing to our broad domain of coding. As we prepare for 2023, there are hundreds of tools that exist in the data industry and are actively used to some extent. Some are cutting-edge programming languages and some are legacy tools that have been around since the 1990s. We will go over the best tools for a data analyst or data scientist, and include recommendations, tips and learning resources – so you can start dipping your toes in data finally or find the next thing to focus on in your career in data.
Note: If you are interested, you can find a video on different tools to learn for data science here:
This post’s approach will be slightly different from the usual top X lists. There is no such thing as a useless tool; so we will group them up into a core section, then use case-specific areas, and some special groups that I will discuss based on my experience and exposure to them. There will be missing tools, and you may see your favourite tool in another group than you expected or not see it all together. This means, for the majority of cases, that the tool has too niche of an application to be in this list, and nothing more.
Core Tools – Programming languages
Our first section is about the core tools you need to be able to do anything with data. You should learn three languages: SQL, Python, and R.
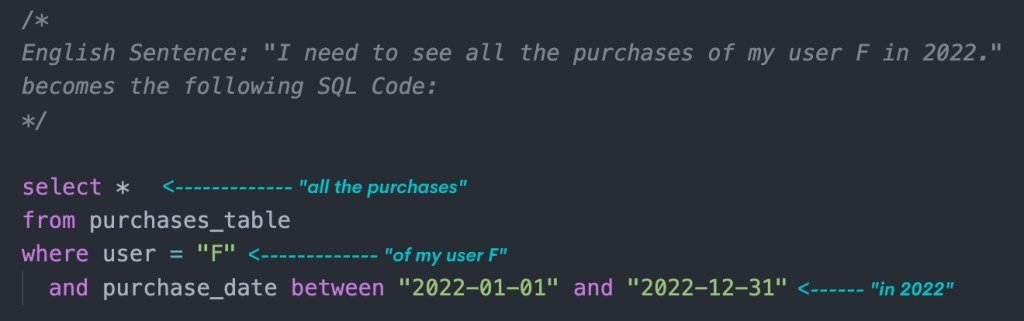
- SQL: The Standard Querying Language is the most important tool you will need to get data to work on. There are different types of data, but within organizations or areas with a lot of data, that data is stored in SQL databases. The good news is, SQL is very simple to learn. It may have the closest syntax and sentence structure to regular English out of any programming language. When you first begin learning, I would advise you to first write out the data you need in English, and translate it to SQL. For example:
- Python: I find it funny that one of the most common words you find in IT lingo is the name of a snake. Python is an amazing programming language that is easy to learn, write and bug fix, and it has an incredible feature: packages. Smart and experienced Python developers create these packages that add functionality to the language that is very simple to use. The most used packages for data analysts and data scientists are pandas (data manipulation), matplotlib or plotly or seaborn (visualization), NumPy (statistics & math) and sklearn (data science & machine learning). I am a huge fan of tools designed for making a job simpler, and Python makes retrieving, cleaning, analysing and reporting data very simple indeed. On top of this, it is a common tool in backend development so implementing data projects to products is much easier as well!
- R: I love R; it is incredible. It is a language specifically designed for data science and statistical learning and as a result, excels at these tasks. All of the tasks we mentioned in the Python section like cleaning and analysing data are even more straightforward in R. It also has packages, called “libraries”; and a specific set of them called the “tidyverse” is a constantly improving group of libraries for data scientists.
R has an interesting problem; where the regular R development environment is very bare-bones. To solve this, I recommend using R Studio (which you can find here); a free software that lets you write R and analyse data with an efficient and beautiful design.
These three languages are things you definitely need to get comfortable with using, as they cover the entire data analytics and data science workflow amongst themselves. You will prefer R or Python over the other (see sidebar), but it is a big plus to be as tool agnostic as possible and use whichever will give the most accurate results fastest for your project.
R vs. Python
The data community seems to be divided between R and Python for a long time. At least there are no extremists on either side, but most people have a preference between the two. In my view, as the company or data structure is more established, R shines more as it focuses on data without having to worry about fixing or directly working with other areas. Python is much easier to implement into an existing product and is more effective at connecting with backend services. So if you need to wear multiple hats, for example in the fast growth stage of a startup, going with Python will make your workflow much faster and collaborating with other teams much easier.
Data Visualization Tools
Analysing the data is usually as beneficial as the analyst’s ability to deliver the insights. We find charts and single, well-defined numbers much more useful than looking at giant tables of seemingly random numbers. We will go over all the different delivery methods in another post, but almost all of them will involve charts – so here are the best and most common visualization tools for charts in the data industry.
- Excel: This may be the software that is most used in IT and finance. The years of development and improvement of the Microsoft Suite made it the go-to choice for anybody who needs to draw some charts. This usually involves finding or massaging the data before putting it into Excel, but even those parts can be done in Excel to some extent. The best part in my opinion is the ability to control every aspect of a chart, so you can build the exact thing you imagine. Making dynamic charts is a bit challenging, but other tools are aiming to solve this issue anyhow. It is a very popular tool that data analysts need to know despite not being labelled as such in job posts.
- Tableau: Dashboards are a great tool to really emphasize the data culture and make it easy to bring data to discussions in projects. A data dashboard, similar to dashboards in cars, shows the most important information in an easy-to-grasp way for your task (driving a car, or driving growth in a company). Tableau is an industry powerhouse that is frequently used for good reason; it has great data ingestion, a logical and simple way to approach visualizations, and a lot of control as you gain expertise. You will most likely encounter Tableau in your career at one point or another, and lessons from Tableau development will definitely be useful throughout your journey.
Gateway Tools
I lovingly refer to these as “gateway tools”, a way to get into data science and data analytics although eventually, you will need to move on to some of the core and visualization tools mentioned above. People get involved with these either through academia or through established companies with legacy systems. The drawback of these are usually they are either not designed specifically for analysis, or designed to be so user-friendly and simplistic that the potential of impactful insight from data is lower. My list of these tools is SAS, SPSS, Matlab, Oracle* and PowerBI*. Oracle is more of a data storage solution in my view; but offers good summarization solutions, while PowerBI is an end-to-end tool that is great on its own but improves only a few transferrable skills.
One resource to learn about all of this is analysef.uk, so subscribe to be notified of new posts on these topics and more! In the meantime, here is one beginner resource per tool to start learning today!
- SQL: W3 Schools has a comprehensive course: https://www.w3schools.com/sql/
- R: A free online book for data science with R: https://r4ds.had.co.nz/index.html
- Python: Datacamp has a free section as a Python introduction, although you need to at least signup: https://www.datacamp.com/courses/intro-to-python-for-data-science
- Tableau: Official Tableau training resources are the best source: https://www.tableau.com/en-gb/learn/training/20221
Conclusion
The tools covered in this post should give you a good foundation to work your data science and data analytics magic without being slowed down by inefficiencies or annoyances. All of them are either designed entirely for data or have a dedicated sub-community of data experts. Us data experts should strive to always keep on learning and improve our skills with these tools, no matter where we are in our careers.